CircuData Cockpit: The AI Cockpit for Your Data Streams
Our own product makes visible what's really happening in your data pipelines: CircuData Cockpit monitors Airbyte, Kafka, and PostgreSQL in real time, automatically detects anomalies – and the built-in AI analyst Nova explains in plain language what to do.
Request a CircuData Cockpit DemoEvery Number in Your Reporting Is Only as Good as the Pipeline Behind It
Between ERP, CRM, webshop, and data platform, millions of records flow every day. When a synchronization fails silently, your company ends up working with incorrect numbers – often unnoticed for weeks. CircuData Cockpit ends this blind flight: a cockpit that shows the status of all data streams live and reports problems before they end up in the monthly report.
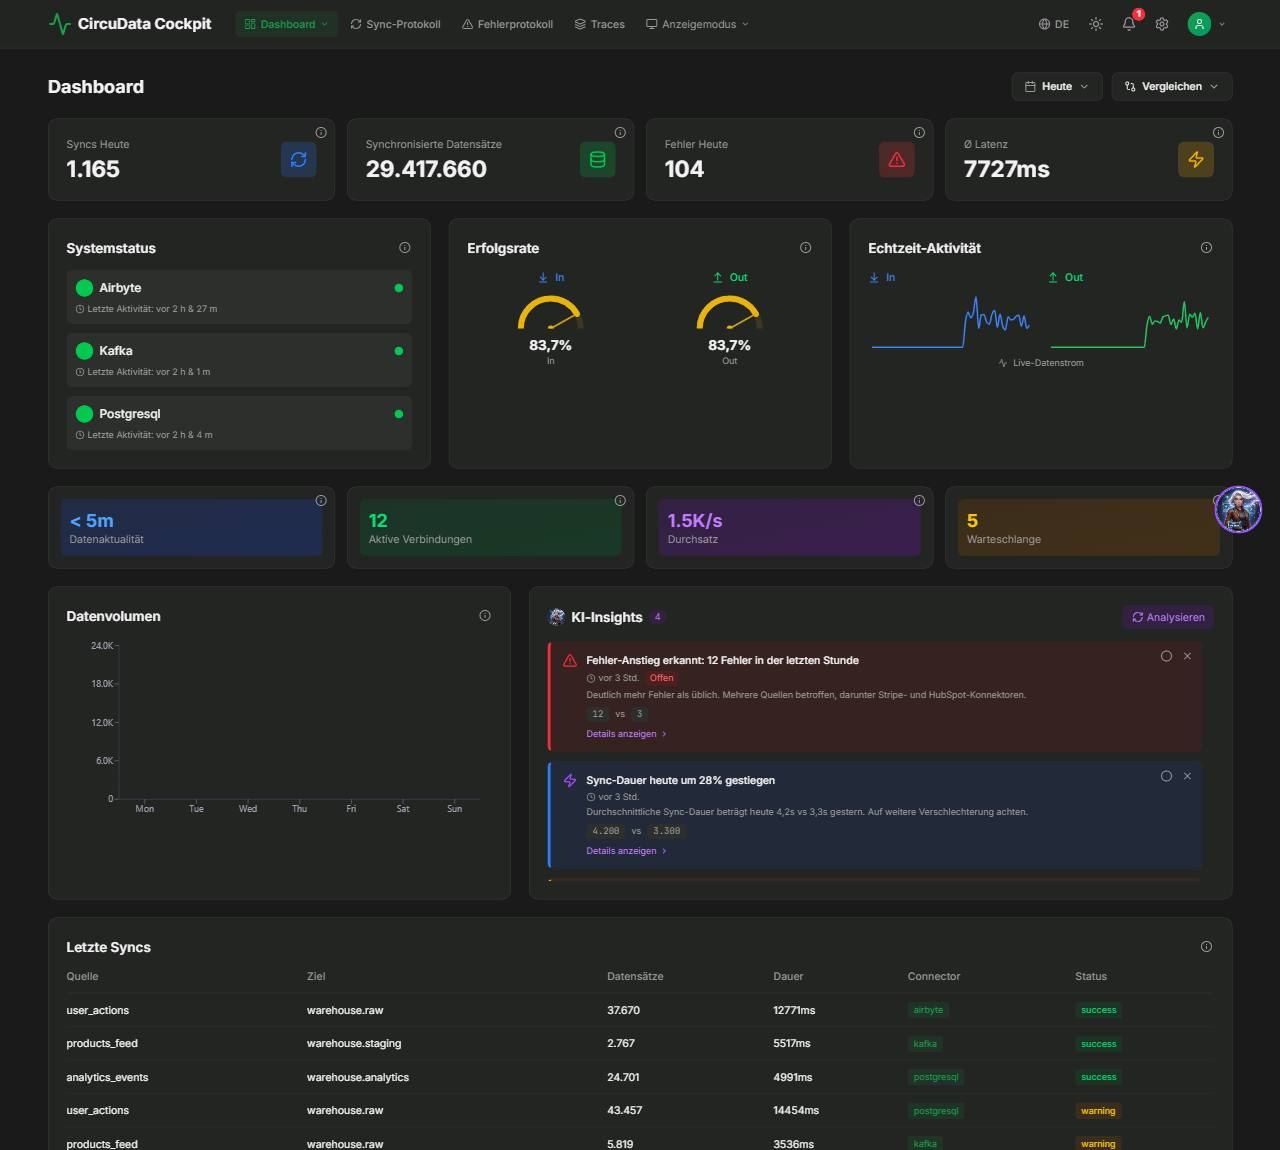
The CircuData Cockpit dashboard live: syncs, records, errors, latency, and system status of all connectors at a glance.
All Your Data Streams at a Glance
Syncs, errors, latency, and the live status of Airbyte, Kafka, and PostgreSQL – as a traffic light instead of flying blind. You see immediately whether your reporting is based on current data, without opening a single log file.
What CircuData Cockpit Keeps an Eye on for You
Real-Time Dashboard
Syncs, transferred records, errors, latency, throughput, and queues – live and at a glance, including traffic-light status per system and data freshness.
AI Insights: Anomalies Detected Automatically
CircuData Cockpit continuously compares against the normal state and reports anomalies by priority: „Error spike detected: 12 errors in the last hour“ or „Sync duration up 28% today.“
Nova, Your AI Analyst
Nova summarizes every day in plain language, analyzes root causes of errors including the main source – and answers your questions in chat. No log-reading, no guesswork.
Error Log with Resolution Status
Every error carries its resolution: automatic retry, schema updated, or manually resolved. You see immediately what the system has healed itself and where action is needed.
Traces Based on OpenTelemetry
Every record can be traced end-to-end – from the source system to the warehouse, span by span. That's data integrity in practice: traceable instead of a black box.
Display Modes for IT Screens
Overview, live ticker for syncs and errors, or views per data source – as a wallboard for the screen in the team office or the IT control room.
Nova Instead of Log Files
This is what data quality looks like that even management enjoys: Nova summarizes 142 syncs, the success rate, and the day's resolved issues in two sentences – and if you like, you can simply chat with her.
Nova Explains What Happened
Every morning, the AI analyst Nova summarizes the sync activity in plain language: success rate, errors, health status – and what she has already resolved herself. She answers follow-up questions directly in chat.
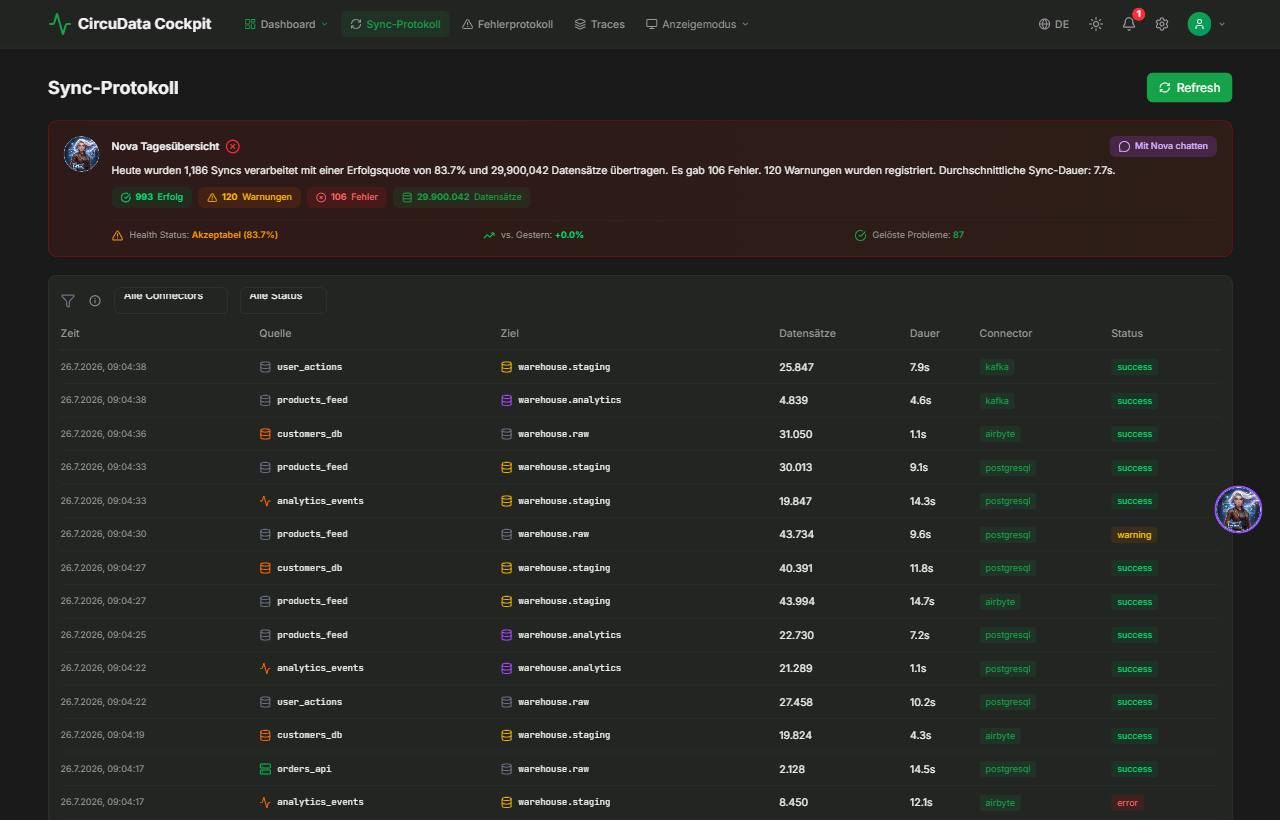
Nova's daily overview in the sync log: plain language instead of log files, including health status and „Chat with Nova.“
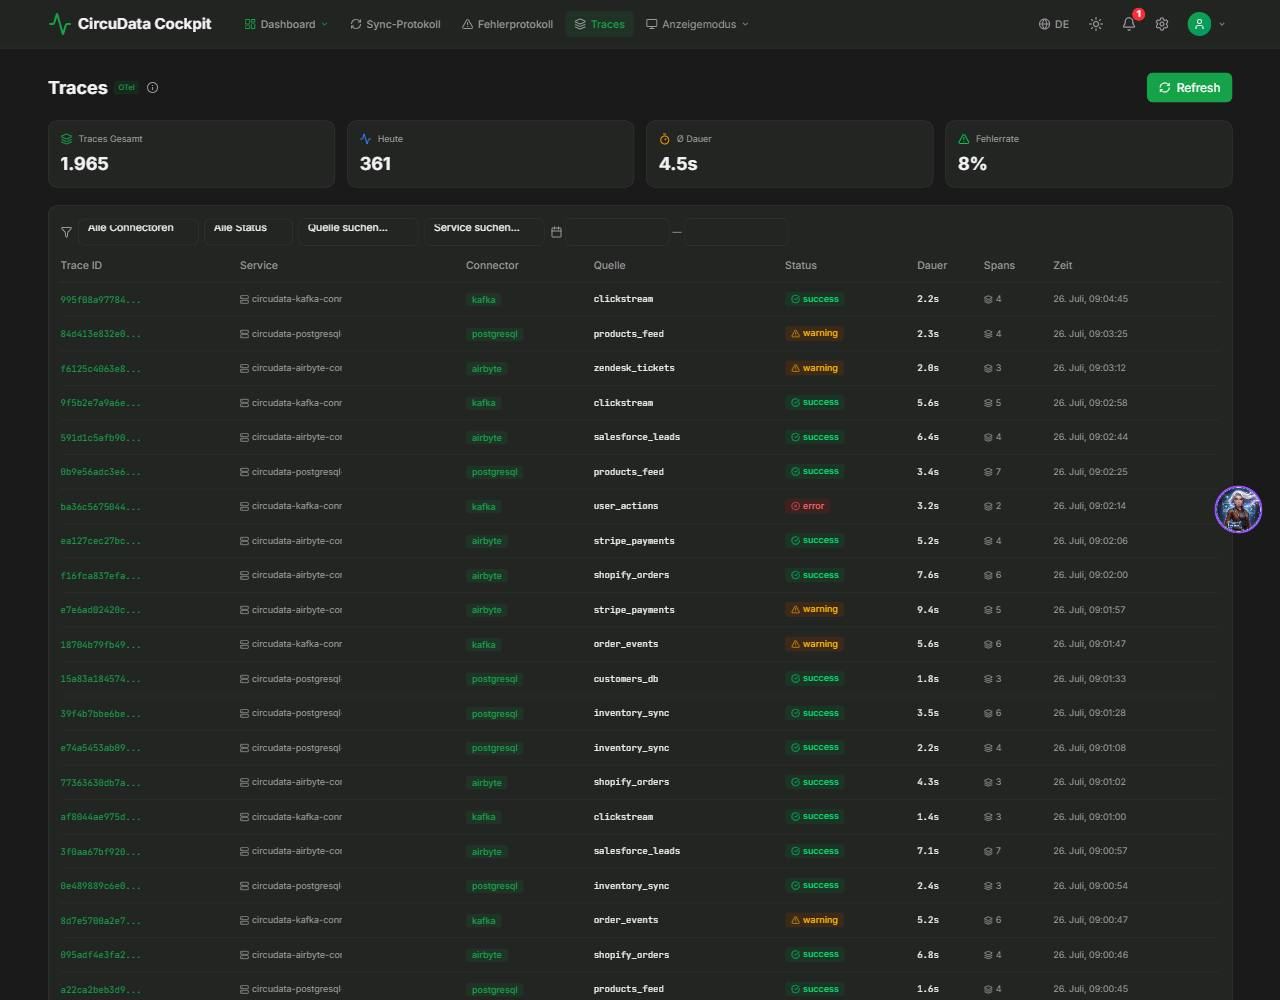
Traces: every sync traceable end-to-end – with duration, spans, and status per connector.
Trace Every Record Back to the Source
Traces based on OpenTelemetry show end-to-end which path a record has taken. Troubleshooting and audit evidence now take minutes instead of days.

„Most companies only notice at month-end that an interface has been faulty for weeks. With CircuData Cockpit, you see it the moment it happens – and Nova tells you right away why.“
A Building Block of Our Data Integration Pillar
CircuData Cockpit is built on the same open, Europe-operable stack we recommend to our customers: Airbyte, Kafka, PostgreSQL, OpenTelemetry – self-hosted or hosted in the EU, in line with our Europe Commitment. And it's the visible proof of our conviction: clean data is the foundation of any AI. If you don't monitor your pipelines, you're building AI on sand. And because Odoo is our leading system, the cockpit can be linked directly to Odoo ERP – your ERP data streams appear as their own source in monitoring.
See Your Data Streams for the First Time, for Real
In a live demo, we'll show you CircuData Cockpit with real pipelines – and discuss how the cockpit fits your system landscape.
Request a CircuData Cockpit DemoFrequently Asked Questions about CircuData Cockpit
Which systems does CircuData Cockpit monitor?
CircuData Cockpit monitors data pipelines based on Airbyte, Kafka, and PostgreSQL – and thus the data streams from connected sources such as ERP, CRM (e.g. HubSpot, Salesforce), shop (e.g. Shopify), payment services (e.g. Stripe), or inventory databases. We clarify which sources apply to you during onboarding.
What exactly does the AI in CircuData Cockpit do?
Two things. The AI Insights automatically detect anomalies – such as a spike in errors in the last hour or a 28% increase in sync duration – and display them by priority. And Nova, the built-in AI analyst, summarizes your day, analyzes root causes of errors, and answers questions in chat: „Why did 12 syncs fail last night?“
Do we need a large data platform team for this?
No – that's exactly what CircuData Cockpit is built for. Instead of log files and consoles, there's a cockpit that even business stakeholders can read: traffic-light status, plain-language summaries, and concrete resolution notes like „Automatic retry“ or „Schema updated.“
Where does CircuData Cockpit run – and what about data privacy?
CircuData Cockpit relies on an open stack (Airbyte, Kafka, PostgreSQL, OpenTelemetry) that can run entirely in Europe or on your own premises – in line with our Europe Commitment. Your data stays in your infrastructure; the cockpit displays metadata and status information.
What sets CircuData Cockpit apart from Grafana or Kibana?
Grafana and Kibana are powerful generalists that a technical team first has to configure. CircuData Cockpit is specialized in data pipeline monitoring for mid-sized businesses: pre-configured for Airbyte/Kafka/PostgreSQL, with AI analyses in plain language instead of query language – ready to use instead of a project.
How do we roll out CircuData Cockpit?
We connect CircuData Cockpit to your existing pipelines – or build the data integration alongside it (our Data Integration & Data Integrity pillar). Typically: first the data maturity audit, then the connection, then the cockpit and monitoring run in everyday operations.
Which data sources can be connected?
Anything with an interface: ERP, CRM, shop, accounting, machine and telematics data – directly or via Airbyte with its several hundred connectors. We also bring along legacy CSV data.
How quickly do we see initial results?
The first pipelines and dashboards are typically ready after a few weeks. We start with the two or three metrics you really need every day – and build from there.
Does CircuData replace our existing BI tools?
Not necessarily. CircuData bundles the data streams and monitors them with AI – existing BI tools can build on top of it. Many customers, however, no longer need a second tool afterward.
How do the AI Insights work technically?
The AI continuously observes your data streams and reports anomalies in plain language: error spikes, unusual sync durations, missing data deliveries. Instead of interpreting charts, you read recommendations.